In this blog, we will monitor the AWS EC2 instances using Prometheus and visualize the dashboard using Grafana.
Checkout my YouTube Video for this blog
Agenda
- Prometheus Architecture
- Install Prometheus and configure Prometheus to monitor itself
- Install Node Exporter on other EC2 Instances
- Configure Prometheus for the EC2 Instance
- EC2 Service Discovery for Prometheus
- Install Grafana
Prerequisite:
- Prometheus EC2 instance
t2.micro - Node EC2 instances to monitor
- Security Groups Configured properly
- Clone this git repo
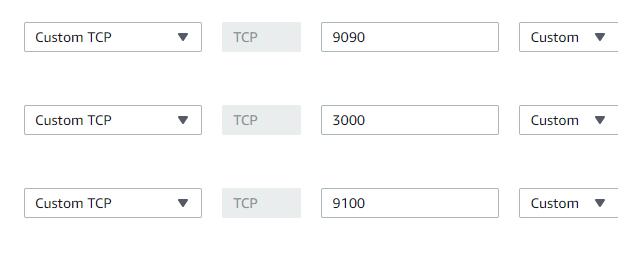
Security Groups Configured on EC2 Instances
Port 9090 — Prometheus Server
Port 9100 — Prometheus Node Exporter
Port 3000 — Grafana
Prometheus EC2 Instance
Configure the security group on EC2 Instance where Prometheus Server is installed as shown below :
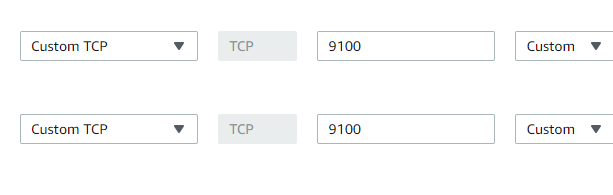
Node EC2 Instances
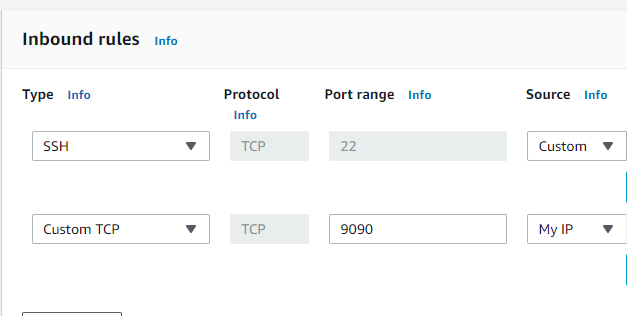
Configure the security group on EC2 Instance which you want to monitor and where you will install Node Exporter as shown below:
One entry is from your IP and one entry is the IP of the EC2 instance where Prometheus server is installed so that Prometheus server can read the metrics which is exposed on the Node server.
Prometheus Architecture
- Prometheus is an open source tool for monitoring and alerting applications
- a multi-dimensional data model with time series data identified by metric name and key/value pairs
- Uses PromQL ( Prometheus Query Language)
- time series collection happens via a pull model over HTTP
- Targets System which you want to monitor can be identified using Service Discovery or by static configuration in the yaml file
Below is the diagram of Prometheus architecture and its components
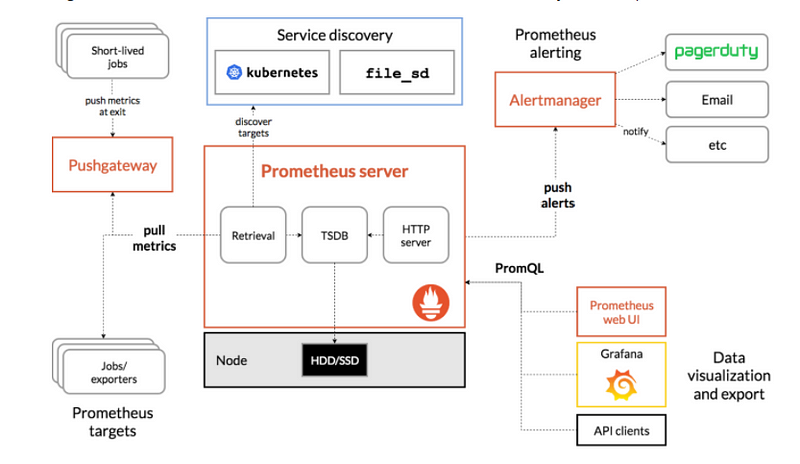
- Prometheus Server: This component is the central component that collects the metrics from multiple nodes. Prometheus uses the concept of scraping, where target systems’ metric endpoints are contacted to fetch data at regular intervals.
- Node Exporter: This is called a monitoring agent which we installed on all the target machines so that Prometheus can fetch the data from all the metrics endpoints
- Push Gateway: Push Gateway is used for scraping metrics from applications and passing on the data to Prometheus. Push Gateway captures the data and then transforms it into the Prometheus data format before pushing.
- Alert Manager: Alert Manager is used to send the various alerts based upon the metrics data collected in Prometheus.
- Web UI: The web UI layer of Prometheus provides the end user with an interface to visualize data collected by Prometheus. In this, we will use Grafana to visualize the data.
Install Prometheus
Now we will install the Prometheus on one of the EC2 Instance.
You can download the latest version from here
- Clone my git repo
- Run the
install-prometheus.shscript - This script will install everything and configured it. You can change the version as per your project.
This script will do the below steps:
- Create a new user and add new directories
sudo useradd --no-create-home prometheus
sudo mkdir /etc/prometheus
sudo mkdir /var/lib/prometheus
2. Download the Prometheus, extract it and put it in /usr/local/bin folder and finally delete the software
wget https://github.com/prometheus/prometheus/releases/download/v2.23.0/prometheus-2.23.0.linux-amd64.tar.gz
tar -xvf prometheus-2.23.0.linux-amd64.tar.gz
sudo cp prometheus-2.23.0.linux-amd64/prometheus /usr/local/bin
sudo cp prometheus-2.23.0.linux-amd64/promtool /usr/local/bin
sudo cp -r prometheus-2.23.0.linux-amd64/consoles /etc/prometheus/
sudo cp -r prometheus-2.23.0.linux-amd64/console_libraries /etc/prometheus
sudo cp prometheus-2.23.0.linux-amd64/promtool /usr/local/bin/
rm -rf prometheus-2.23.0.linux-amd64.tar.gz prometheus-2.19.0.linux-amd64
3. Now we will configure Prometheus to monitor itself using yaml file. Create a prometheus.yml file at /etc/prometheus/prometheus.yml with the below content
global:
  scrape_interval: 15s
  external_labels:
    monitor: 'prometheus'
scrape_configs:
  - job_name: 'prometheus'
    static_configs:
      - targets: ['localhost:9090']
4. Now we want to run the Prometheus as a Service so that in case of server restart service will come automatically.
Let’s create a file /etc/systemd/system/prometheus.service with the below content:
[Unit]
Description=Prometheus
Wants=network-online.target
After=network-online.target
[Service]
User=prometheus
Group=prometheus
Type=simple
ExecStart=/usr/local/bin/prometheus \
    --config.file /etc/prometheus/prometheus.yml \
    --storage.tsdb.path /var/lib/prometheus/ \
    --web.console.templates=/etc/prometheus/consoles \
    --web.console.libraries=/etc/prometheus/console_libraries
[Install]
WantedBy=multi-user.target
4. Change the ownership of all folders and files which we have created to the user which we have created in the first step
sudo chown prometheus:prometheus /etc/prometheus
sudo chown prometheus:prometheus /usr/local/bin/prometheus
sudo chown prometheus:prometheus /usr/local/bin/promtool
sudo chown -R prometheus:prometheus /etc/prometheus/consoles
sudo chown -R prometheus:prometheus /etc/prometheus/console_libraries
sudo chown -R prometheus:prometheus /var/lib/prometheus
5. Now we will configure the service and start it
sudo systemctl daemon-reload
sudo systemctl enable prometheus
sudo systemctl start prometheus
sudo systemctl status prometheus
Now open it on the browser using below url:
http://18.220.110.81:9090/
If you are not able to access it then make sure your security group is configured for port 9090 and its open from your IP.
Install Node Exporter
Now to monitor your servers you need to install the node exporter on all your target machine which is like a monitoring agent on all the servers.
You can clone this repo and run it directly using below command
./install-node-exporter.sh
This script will do the below steps:
It will create a new user , download the software using wget and then run the node-exporter as a service
sudo useradd --no-create-home node_exporter
wget https://github.com/prometheus/node_exporter/releases/download/v1.0.1/node_exporter-1.0.1.linux-amd64.tar.gz
tar xzf node_exporter-1.0.1.linux-amd64.tar.gz
sudo cp node_exporter-1.0.1.linux-amd64/node_exporter /usr/local/bin/node_exporter
rm -rf node_exporter-1.0.1.linux-amd64.tar.gz node_exporter-1.0.1.linux-amd64
sudo cp node-exporter.service /etc/systemd/system/node-exporter.service
sudo systemctl daemon-reload
sudo systemctl enable node-exporter
sudo systemctl start node-exporter
sudo systemctl status node-exporter
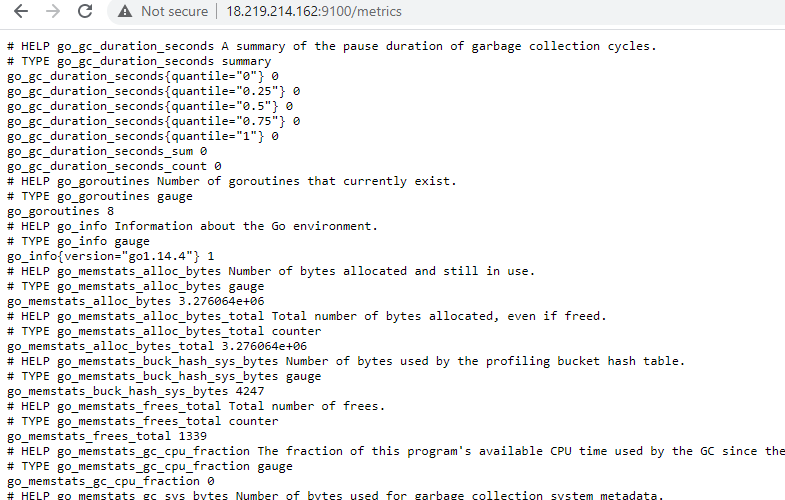
Make sure port 9100is open from your IP to access this url. You should be able to access all the metrics which is coming from this server.
http://3.129.211.10:9100/metrics
Configure Prometheus for the Nodes
Now we will configure the Prometheus for our EC2 instance where we have installed the node-exporter.
Login to the Prometheus server and edit the file or you can clone this file/etc/prometheus/prometheus.yml
global:
  scrape_interval: 15s
  external_labels:
    monitor: 'prometheus'
scrape_configs:
- job_name: 'node_exporter'
static_configs:
- targets: ['18.219.214.162:9100']
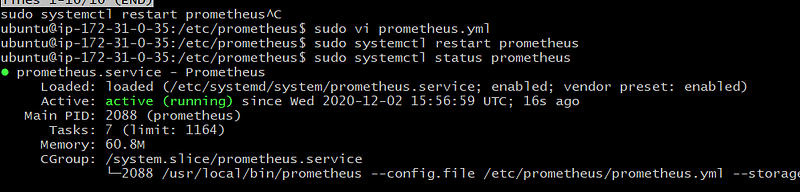
Restart the Prometheus Service
sudo systemctl restart prometheus
sudo systemctl status prometheus
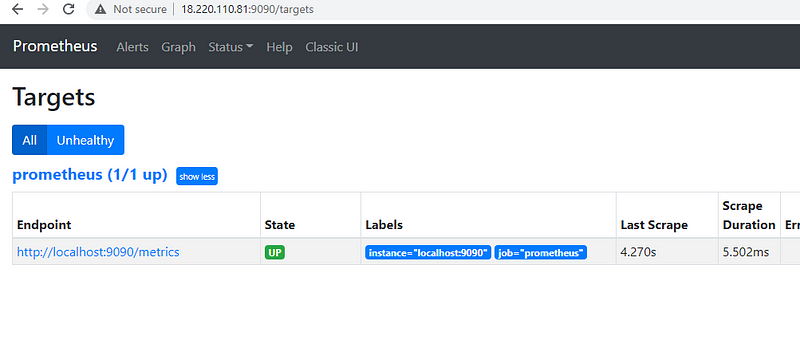
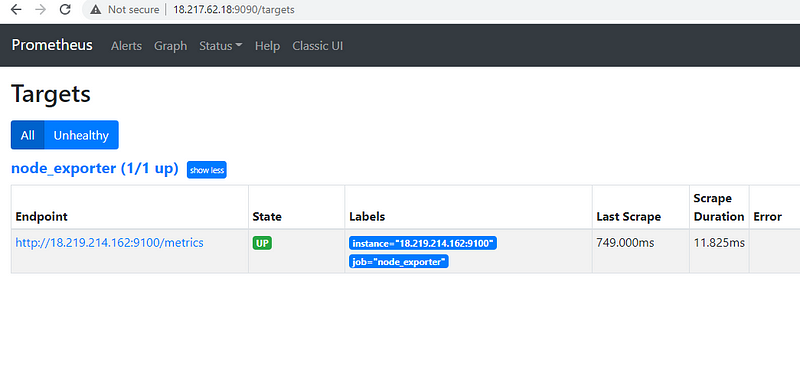
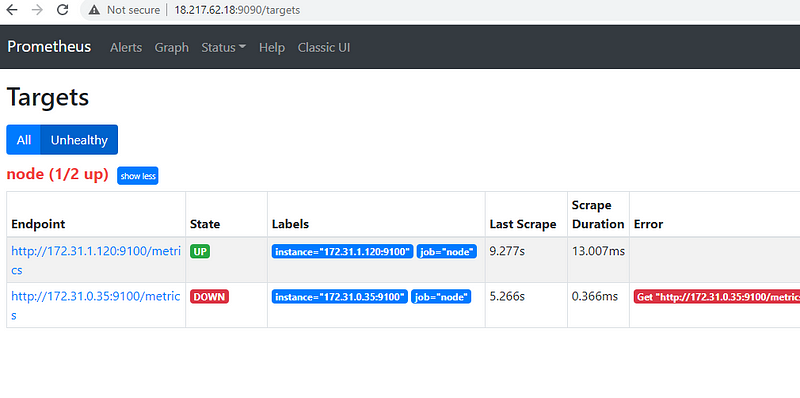
Now you can open the Prometheus using below url and can see the new targets added
http://18.217.62.18:9090/targets
Prometheus Service Discovery on EC2 Instance
Now we will use Service discovery so that we don’t need to change the Prometheus configuration for each of the instance
You can clone this file and update the /etc/prometheus/prometheus.yml file with the below content
global:
  scrape_interval: 15s
  external_labels:
    monitor: 'prometheus'
scrape_configs:
  - job_name: 'node'
    ec2_sd_configs:
      - region: us-east-2
        access_key: yourkey
        secret_key: yourkey
        port: 9100
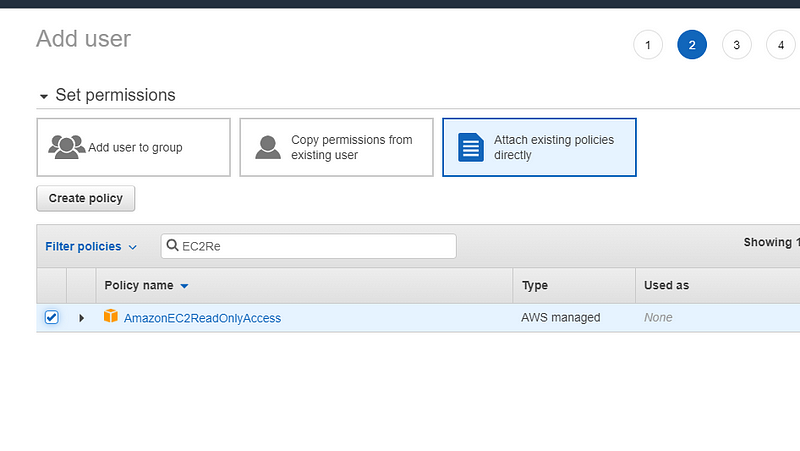
Specify the AWS region and use IAM user API key which has EC2ReadyOnlyAccess . If there is no user available then you can create one and add the below policy.
Restart the service
sudo systemctl restart prometheus
sudo systemctl status prometheus
Service discovery will find the private IP so you need to make sure that in your security group you add this private IP also
One is showing down because it fetches all the nodes which are in us-east-1 region and we have not installed node-exporter on the Prometheus server itself.
This is how you can use the Service discovery in Prometheus for all the EC2 instances.
Install Grafana
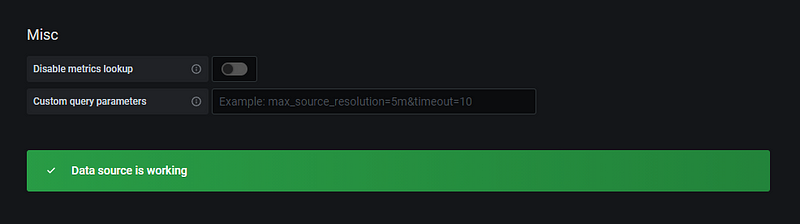
Once Prometheus is installed successfully then we can install the Grafana and configure Prometheus as a datasource.
Grafana is an opensource tool which is used to provide the visualization of your metrics.
You can download the latest version of Grafana from here
Steps to Install
- clone this git repo
- Run the below file
./install-grafana.sh
This script will do the below steps:
It will download the software using wget and then run the grafana as a service
sudo apt-get install -y adduser libfontconfig1
wget https://dl.grafana.com/oss/release/grafana_7.3.4_amd64.deb
sudo dpkg -i grafana_7.3.4_amd64.deb
sudo systemctl daemon-reload
sudo systemctl start grafana-server
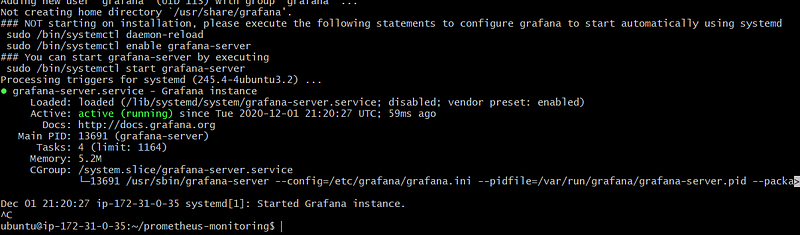
sudo systemctl status grafana-server
sudo systemctl enable grafana-server.service
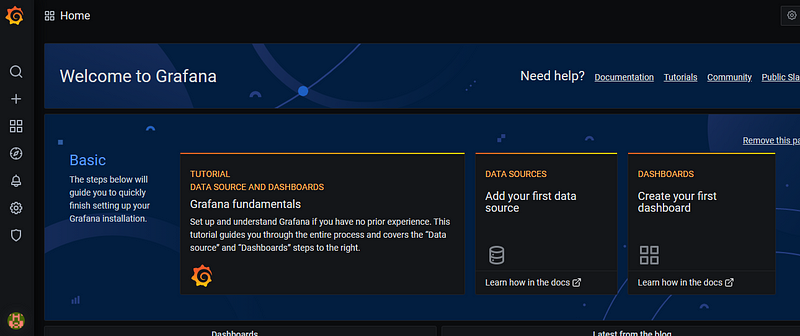
Now open it on the browser using below url:
Make sure that port 3000 is open for this instance.
http://yourip:3000
Login with username : admin and password admin
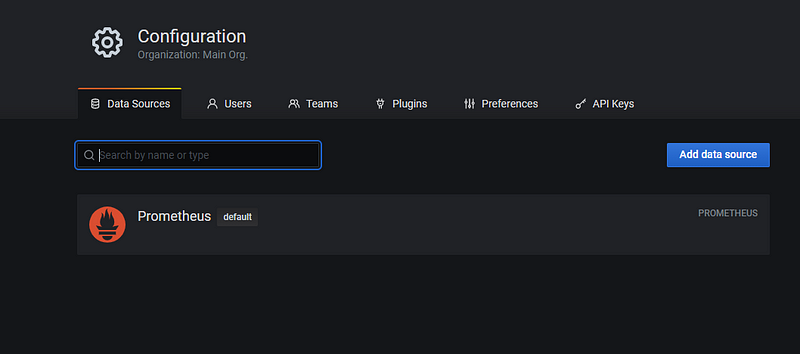
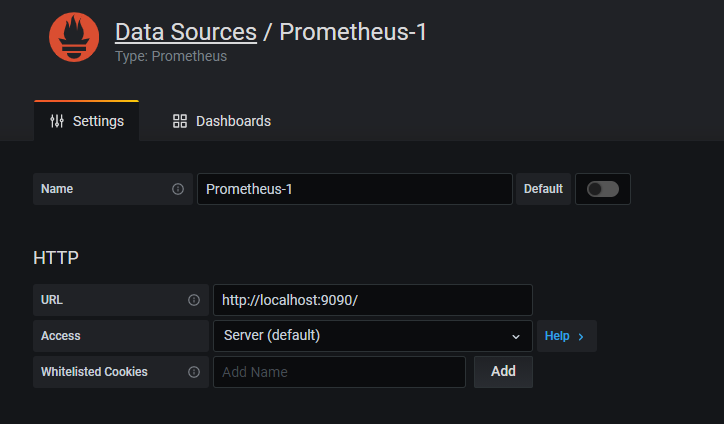
Add Prometheus DataSource
Click on Setting ->datasources
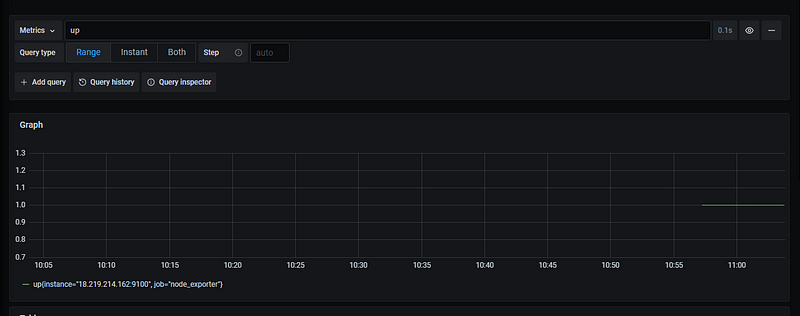
Click on Explore highlighted in red -> Select Prometheus as a datasource as shown below
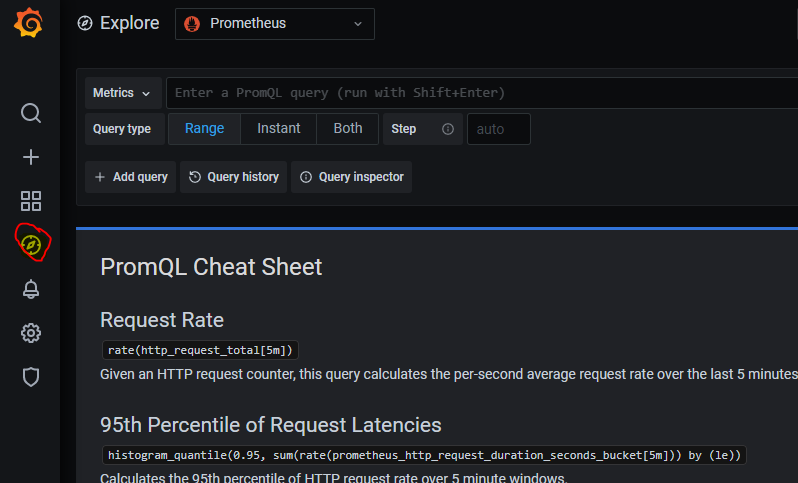
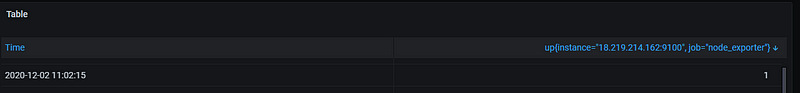
Now you can click on metrics -> Select Up
Output 1 shows that the node is up
There are lot of other metrics which is provided by default and you can use it as per your need.
Now we will create a dashboard which shows us all the node details like CPU, memory, storage etc.
Grafana provides lot of dashboards which we can directly import in our Grafana instance and use it.
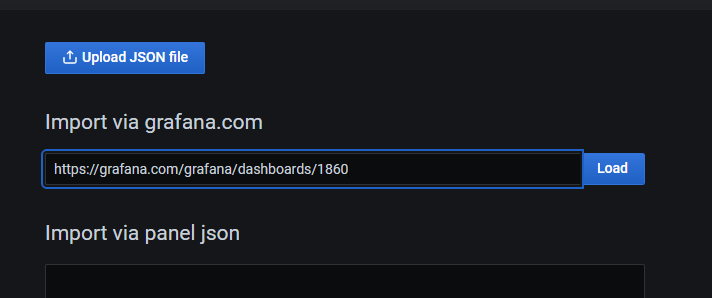
In this example, we will use this dashboard
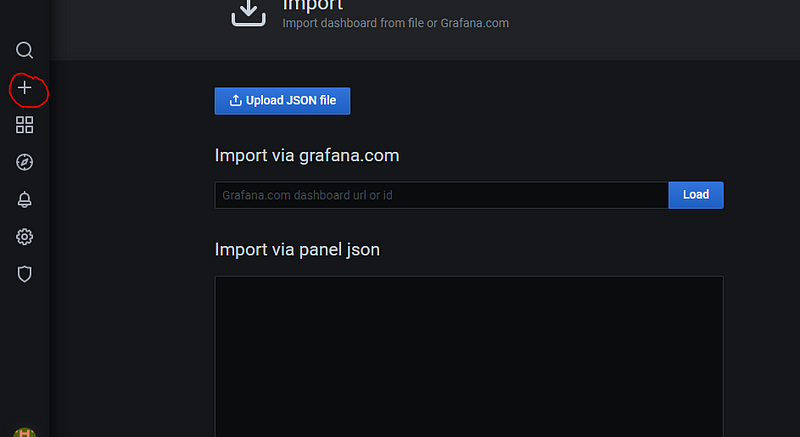
Import the dashboard
Click on + icon -> Import
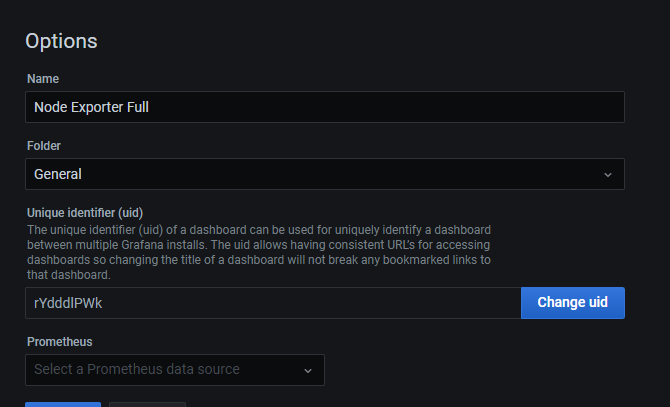
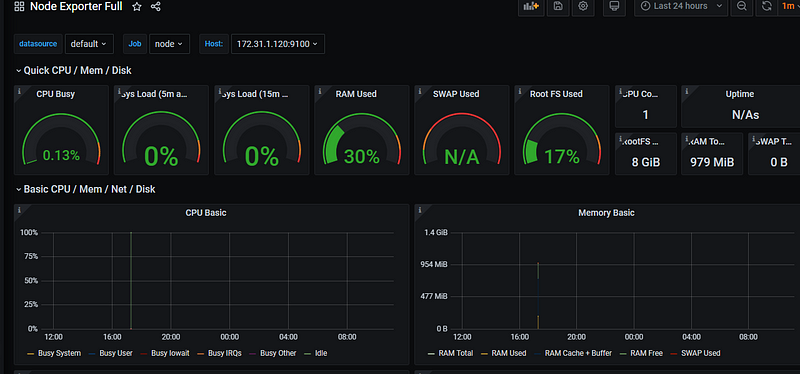
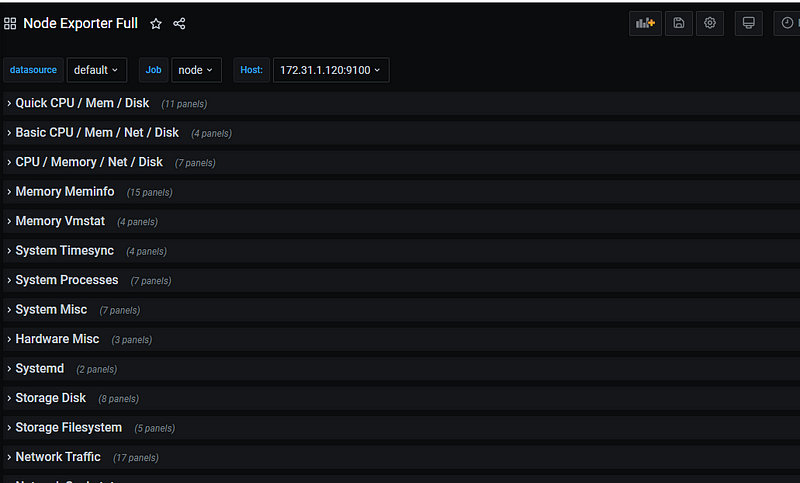
This is how the dashboard will look like and provide all the metrics for your node
Conclusion:
We have successfully learnt how to monitor the AWS EC2 instances using Prometheus and visualize the dashboard using Grafana.