In this blog, we will use Amazon Web Services to build an end-to-end Log Analytic Solution that collects, ingests, processes, and loads both batch data and
Introduction
Real time Data Streaming
Ability to process and analyze data in real-time is essential to do things such as continuously monitor your applications to ensure high service uptime and personalize promotional offers and product recommendations
Batch Processing vs Real time Stream Processing
Consider the monthly billing scenario. By analyzing a customer’s usage data as it is generated, an organization can enable valuable features, such as notifying users that they’re approaching a pre-defined billing limit. If the IT application logs can be analyzed in real-time, a system administrator can be notified immediately to investigate and take corrective action.
Amazon Kinesis Firehose
Amazon Kinesis Firehose is the easiest way to load streaming data into AWS. It can capture, transform, and load streaming data into Amazon Kinesis Analytics, Amazon S3, Amazon Redshift, and Amazon Elasticsearch Service, enabling near real-time analytics with existing business intelligence tools and dashboards that you’re already using today
Amazon Kinesis Agent
The Amazon Kinesis Agent is a stand-alone Java software application that offers an easy way to collect and send data to Kinesis Streams and Kinesis Firehose.
Data Transformation In some scenarios, you might want to transform or enhance your streaming data before it is delivered to its destination. For example, data producers might send unstructured text in each data record, and you need to transform it to JSON before delivering it to Amazon Elasticsearch Service. To enable streaming data transformations, Kinesis Firehose uses an AWS Lambda function that you create to transform your data.
Kafka vs Kinesis: Comparing Real-time Data Streaming Tools
Managed streaming data capabilities offered by Amazon Kinesis, or deploy and manage your own streaming data solution using Apache Kafka. Click here for more details
Logstash — will feed the logs which are generated on your EC2 instance to the elastic search
ElasticSearch
Distributed Lucene search indexes.
REST API
Suitable for full text
real time analytics of structured data
supports signed transactions ( for security )
Kibana Analytics built in
Kibana
— for visualizing your data
Prerequisite/Requirements
Tools Used
- EC2 Instance
- Amazon Kinesis Firehouse -2
- Kinesis Agent
- Amazon Kinesis Analytics
- ElasticSearch
- Kibana — already added as plugin in ElasticSearch
Steps
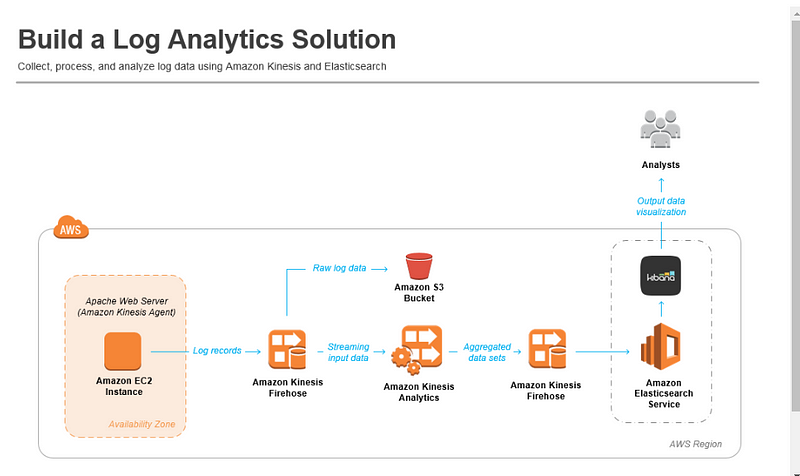
- Install apache server on linux instance and deploy any sample application/ or you can use any log files which is already generated on your EC2 instance.
- Install the Amazon Kinesis Agent on this Linux instance, and the agent will continuously forward log records to an Amazon Kinesis Firehose delivery stream.
- Amazon Kinesis Firehose will write each log record to Amazon Simple Storage Service (Amazon S3) for durable storage of the raw log data and the Amazon Kinesis Analytics application will continuously run an SQL statement against the streaming input data.
- The Amazon Kinesis Analytics application will create an aggregated data set every minute and output that data to a second Firehose delivery stream.
- This Firehose delivery stream will write the aggregated data to an Amazon ES domain.
- Finally, you will create a view of the streaming data using Kibana to visualize the output of your system.
Log Analytic Solution
Now we will implement a build log Analytic solution as per the below architecture
Amazon Kinesis Firehose
- Deliver real-time streaming data to destinations such as Amazon S3, Amazon Redshift, or Amazon ES
- No need to write any application or manage your resources.
- Configure your data producers to send data to Firehose and it automatically delivers the data to the destination that you specified
Amazon Kinesis Analytics
- Process and analyze streaming data in real-time with ANSI standard SQL
- enables you to read data from Amazon Kinesis Streams and Amazon Kinesis Firehose, and build stream processing queries that filter, transform, and aggregate the data as it arrives.
- Amazon Kinesis Analytics runs your queries continuously, and writes the processed results to output destinations such as Amazon Kinesis Streams and Amazon Kinesis Firehose, which can deliver the data to Amazon S3, Amazon Redshift, and Amazon ES.
- Amazon Kinesis Analytics automatically provisions, deploys, and scales the resources required to run your queries.
Setup
Step 1: EC2 instance setup
- Create EC2 instance and connect it using putty.
- Make sure you EC2 instance is serving HTTP traffic
- Note the location of your log file
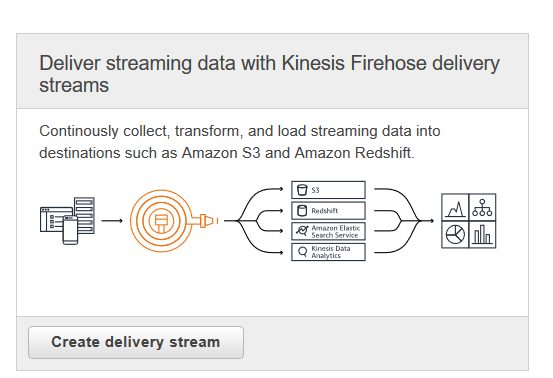
Step 2: Create an Amazon Kinesis Firehose Delivery Stream
- How the log data can be stored on AWS ? We will use Kinesis Firehouse Delivery system to store logs.
- Create Kinesis Firehouse Delivery System
- Open the Amazon Kinesis console at https://console.aws.amazon.com/kinesis.
- Click Go to Firehose.
- Select below option, click Create Delivery stream
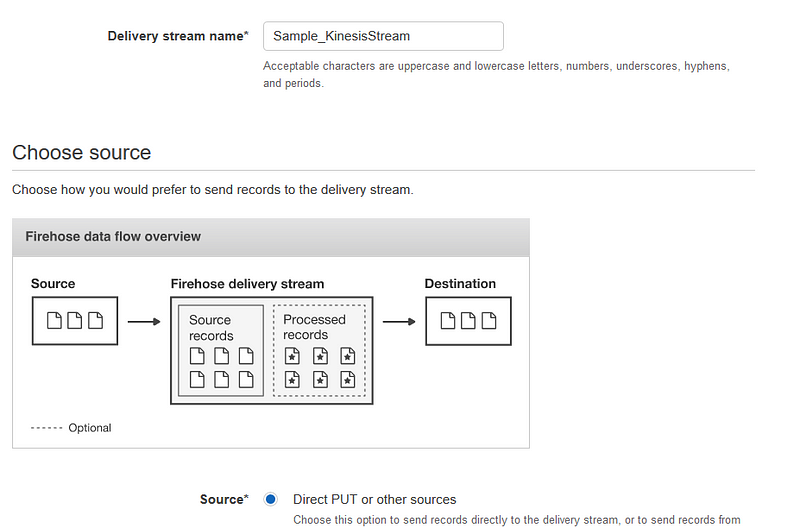
7. Click Next with all default settings
8. On the Destination screen: choose Amazon S3.
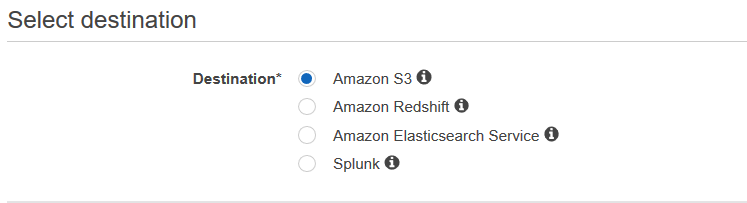
9. Create new S3 bucket or select existing one.
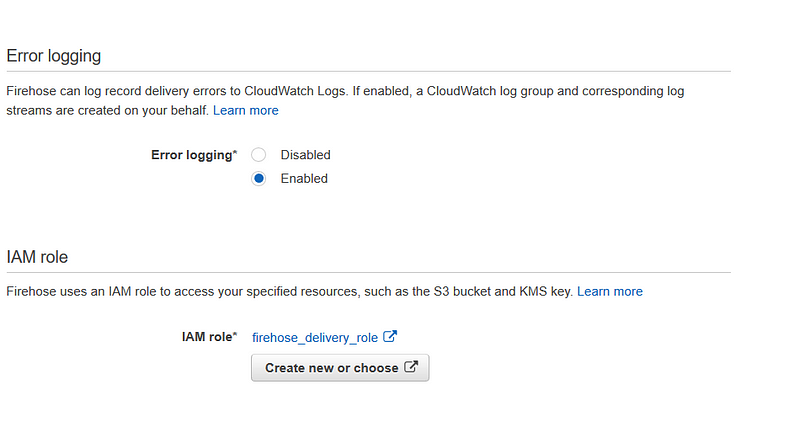
10. On the Configuration screen (see below), you can leave all fields set to their default values. However, you will need to choose an IAM role so that Amazon Kinesis Firehose can write to your Amazon S3 bucket on your behalf.
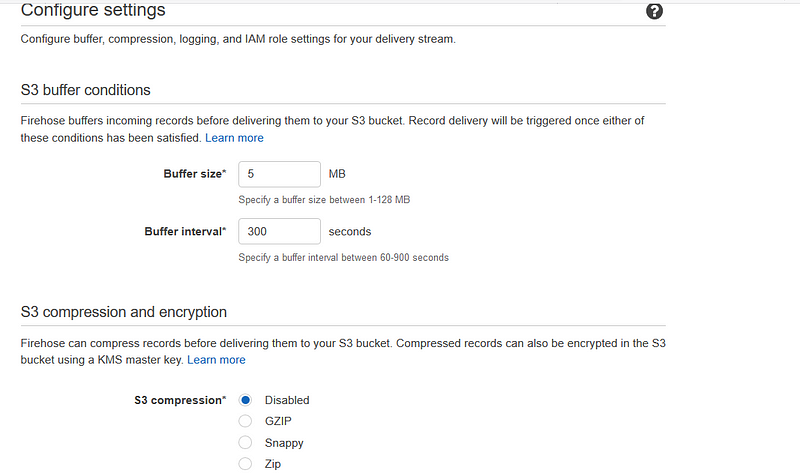
11. . A new screen will open (see below). a. For IAM Role, choose Create a new IAM Role. b. For Role Name, enter firehose_delivery_role. c. Click Next.
11. Review the details of the Amazon Kinesis Firehose delivery stream and choose Create Delivery Stream
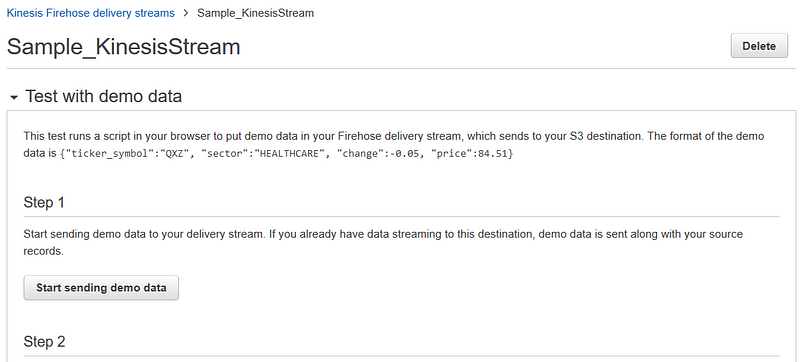
12. Sample data. Click on sending demo data. Data will get stored in S3.
Step 3: Install and Configure the Amazon Kinesis Agent
- Amazon Kinesis Firehose delivery stream ready to ingest your data.
- Configure the EC2 instance to send the data using the Amazon Kinesis Agent software.
- The agent is a stand-alone Java software application that offers an easy way to collect and send data to Firehose. The agent continuously monitors a set of files and sends new data to your delivery stream.
- The Amazon Kinesis Agent can pre-process records from monitored files before sending them to your delivery stream. It has native support for Apache access log files, which you created in Step 1. When configured, the agent will parse log files in the Apache Common Log format and convert each line in the file to JSON format before sending to your Firehose delivery stream
- Install agent. Click here for more details.
sudo yum install –y https://s3.amazonaws.com/streaming-data-agent/aws-kinesis-agent-latest.amzn1.noarch.rpm6. By installing the agent it sets aws-kinesis-agent-user as the owner of /var/run/aws-kinesis-agent
7. Configure Agent
To configure the agent , modify the configuration file located at
vi etc/aws-kinesis/agent.json
Put the log file location and your kinesis stream which you have created above as below
{
 "cloudwatch.endpoint": "monitoring.us-west-2.amazonaws.com",
 "cloudwatch.emitMetrics": true,
 "firehose.endpoint": "firehose.us-west-2.amazonaws.com",
   "awsAccessKeyId": "acesskey",
  "awsSecretAccessKey": "acesskey",
"flows": [
 {
 "filePattern": "/var/log/httpd/*access*",
 "deliveryStream": "Sample_KinesisStream",
 "dataProcessingOptions": [
 {
 "initialPostion": "START_OF_FILE",
 "maxBufferAgeMillis":"2000",
 "optionName": "LOGTOJSON",
 "logFormat": "COMBINEDAPACHELOG"
 }]
 }
 ]
}
8. You have to giver permission to this folder to the kinesis user.Below command will give access to any user
sudo chmod -R ugo+rwx /var/log/httpd
9. Start the agent.
sudo service aws-kinesis-agent startAgent activity is logged in /var/log/aws-kinesis-agent/aws-kinesis-agent.log.
Check real time logs
tail -f /var/log/aws-kinesis-agent/aws-kinesis-agent.log
10. If everything is configured properly, all real time data will get streaming now.
Step 4: Create an Amazon Elasticsearch Service Domain
- Open the Amazon ES console at https://console.aws.amazon.com/es.
- If you have not previously created an Amazon ES Domain, choose Get started. Otherwise, choose Create a new domain.
- On the Define domain screen:
a. For Elasticsearch domain name, enter web-log-summary.
b. For Elasticsearch version, leave it set to the default value.
c. Click Next.
4. On the Configure cluster screen (see below), leave all settings as their default values and click Next.
- Currently, Amazon ES does not support Amazon Kinesis Firehose integration for domains inside a VPC, so choose public access.
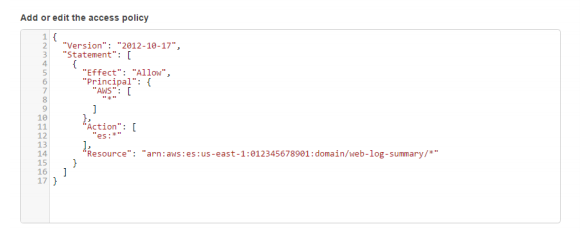
5. On the Set up access policy screen (see below): a. For Set the domain access policy to, choose Allow open access to the domain.
6. Review the details for the Amazon ES domain and click Confirm and create. It will take approximately 10 minutes for the Amazon ES domain to be created.
Step 5: Create a Second Amazon Kinesis Firehose Delivery Stream
In destination , choose elasticsearch service which we have created above
On the Create Delivery Stream screen (see below), do the following:
a. For Destination, choose Amazon Elasticsearch Service.
b. For Delivery stream name, enter web-log-aggregated-data.
c. For Elasticsearch domain, choose the domain you created in Step 4.
d. For Index, enter request_data.
e. For Index rotation, leave it set to “NoRotation” (default).
f. For Type, enter requests.
g. For Retry duration (sec), leave it set to “300” (default).
h. Under Backup S3 bucket, for Backup mode, select Failed Documents Only. i. For S3 bucket, choose New S3 bucket. You will be prompted to provide additional information for the new bucket: For Bucket name, use a unique name. You will not need to use the name elsewhere in this tutorial. However, Amazon S3 bucket names are required to be globally unique. For Region, choose US Standard. Choose Create Bucket.
j. For S3 prefix, leave it blank (default).
k. Click Next.
On the Configuration screen, you can leave all fields set to their default values. However, you will need to choose an IAM role so that Amazon Kinesis Firehose can write to your Amazon ES domain on your behalf. For IAM role, choose Create/Update Existing IAM Role.
6. On the next screen, leave the value of IAM Role set to “firehose_delivery_role”, which you created in Step 2.
7. Set Policy Name to Create a new Role Policy.
8. Click Allow.
9. You will be returned to the Amazon Kinesis Firehose configuration screen. Click Next
Step 6: Create an Amazon Kinesis Analytics Application
- 1. Open the Amazon Kinesis Analytics console at https://console.aws.amazon.com/kinesisanalytics.
2. Click Go to Analytics.
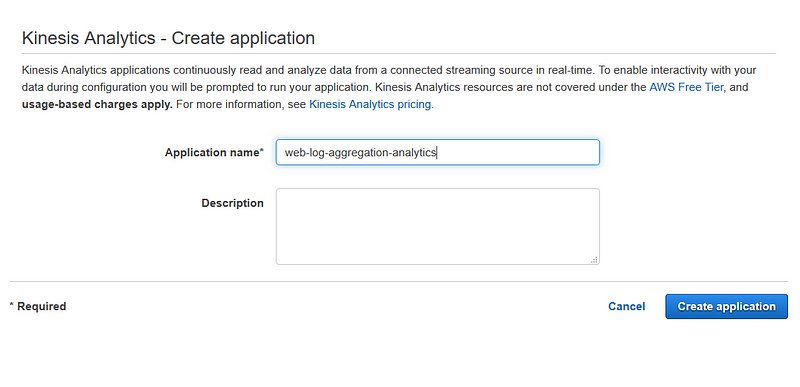
3. Click Create new application
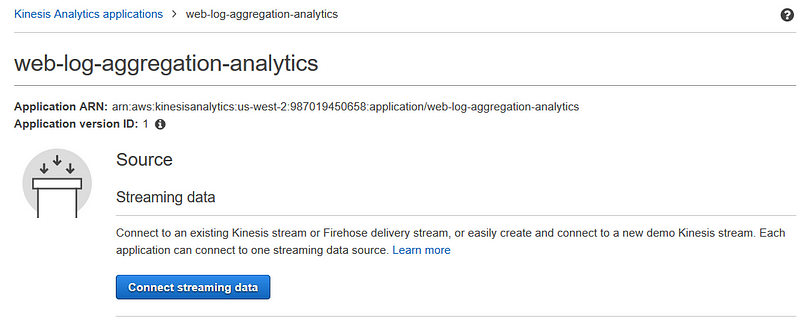
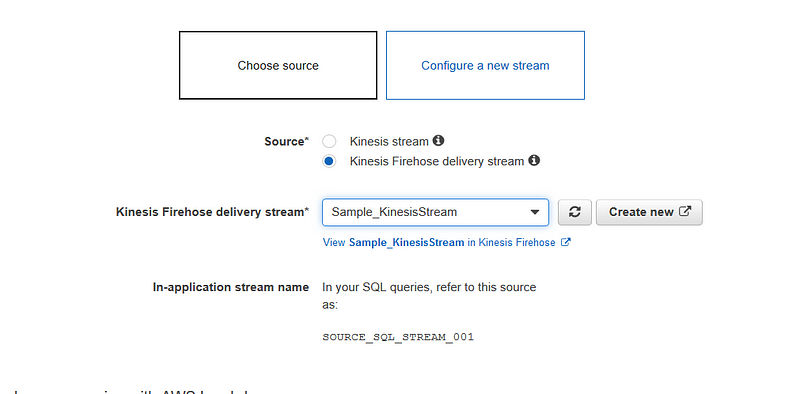
2. Click on connect streaming data -> Choose Kinesis firehouse delivery stream which we have created in step 1
4. Click on Discovery Schema
5. Amazon Kinesis Analytics will analyze the source data in your Firehose delivery stream and create a formatted sample of the input data for your review
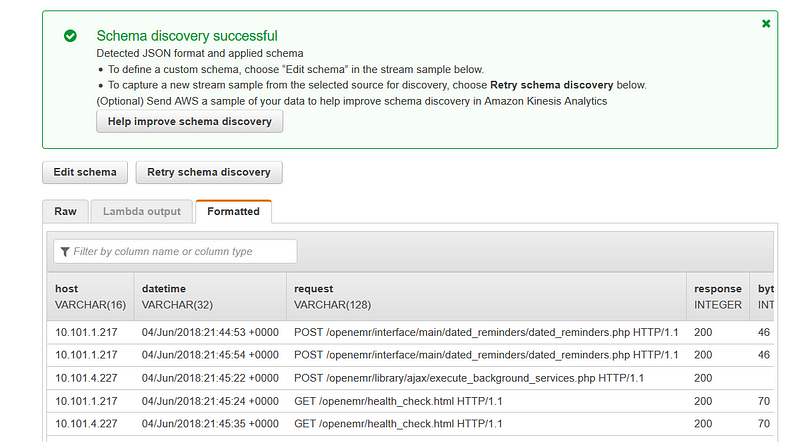
6. Click on Save and Continue
7. You will be taken back to the hub screen for your Amazon Kinesis Analytics application. To create the SQL that will analyze the streaming data, click Go to SQL editor.
In the SQL editor, enter the following SQL code:
CREATE OR REPLACE STREAM “DESTINATION_SQL_STREAM” ( datetime VARCHAR(30), status INTEGER, statusCount INTEGER); CREATE OR REPLACE PUMP “STREAM_PUMP” AS INSERT INTO “DESTINATION_SQL_STREAM” SELECT STREAM TIMESTAMP_TO_CHAR(‘yyyy-MM-dd’’T’’HH:mm:ss.SSS’, LOCALTIMESTAMP) as datetime, “response” as status, COUNT(*) AS statusCount FROM “SOURCE_SQL_STREAM_001” GROUP BY “response”, FLOOR((“SOURCE_SQL_STREAM_001”.ROWTIME — TIMESTAMP ‘1970–01- 01 00:00:00’) minute / 1 TO MINUTE);
8. When prompted, choose Yes, start application.
9. After approximately 60 to 90 seconds, the Source data section will present you with a sample of source data that is flowing into your source delivery stream.
10. Go to Destination Tab
11. Under Select a stream, choose the Firehose delivery stream called “weblog-aggregated-data” that you created above. Leave all other options set to their default values and click Save and continue.
Step 7: View the Aggregated Streaming Data
- Open the Amazon ES console at https://console.aws.amazon.com/es.
- In the Domain column, choose the Amazon ES domain called “web-logsummary” that you created in Step 4.
- The details for the Amazon ES domain will be presented with a link to Kibana. Select the link next to the Kibana item.
- Because this is the first time you are opening the Kibana application in your Amazon ES domain, you will need to configure it to use the Elasticsearch index name that you created in Step 5. In the Index name or pattern field, enter request_data.
- Kibana will automatically identify the DATETIME field in your input data, which contains time data. Choose Create.
6. To visualize the data in our Elasticsearch index, you will create and configure a line chart that shows how many of each HTTP response type were included in the source web log data per minute.
To create the line chart:
a. Click on Visualize in the navigation bar, and choose Line chart.
b. Choose From a new search. To configure your chart, you first need to tell Kibana what data to use for the y-axis:
c. In the metrics section, click the arrow next to Y-Axis to configure this.
d. Under Aggregation, choose Sum.
e. Under Field, choose STATUSCOUNT. Now you need to configure the x-axis: f. In the buckets section, select X-Axis under Select buckets type.
g. Under Aggregation, choose Date Histogram.
7. In the buckets section, choose Add sub-buckets. From Select buckets type, choose Split Lines. 8. Under Sub Aggregation, choose Terms. 9. Under Field, choose STATUS. 10. To run the query and view the line chart, click on the green and white “play” button
References