In this blog, we will do the Jenkins integration with SonarQube. This will help you to check the quality of code using an automated CI/CD pipeline job.
Prerequisite
"Quality cannot be inserted afterwards, rather it must be part of the process."
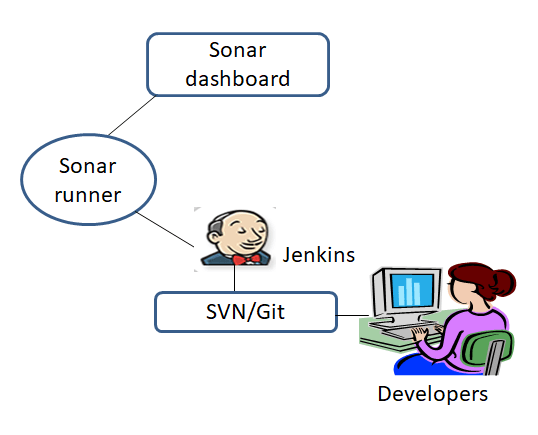
As a good practice in a development team, it is recommended to inspect the source code and make issues visible as soon as code is checked into the source code manager. For this SonarQube is a great choice. However, SonarQube cannot run on an isolated island, it is integrated in a delivery pipeline. It can easily be integrated with various continuous integration (CI) servers to automate the task of static code analysis.
In this blog we will discuss facile steps for Jenkins integration with SonarQube on a simple JAVA project.
Jenkins integration with SonarQube :
Step 1. Download and start SonarQube on web browser.
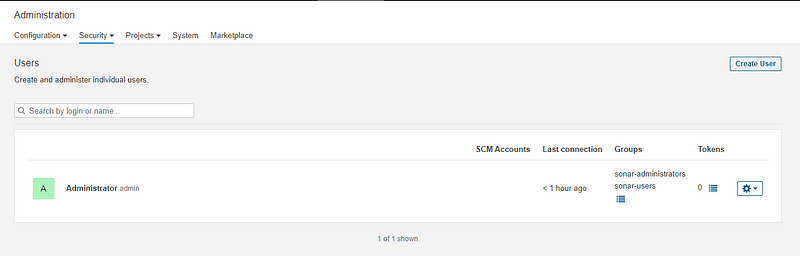
Step 2. Generate the token for any user
Go to Administration-> Security-> Users -> Select User -> Generate Token – Clicck on 5 dashes -> provide a name of your token
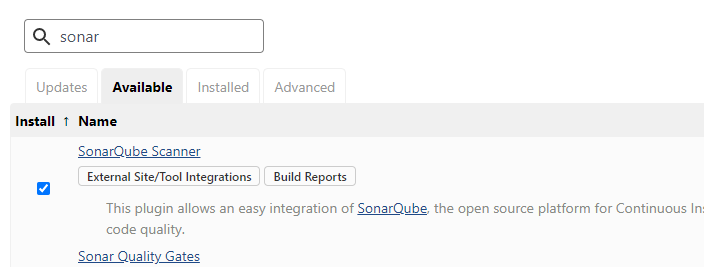
Step 3. Go to Jenkins dashboard -> Manage Jenkins ->Manage plugins->Available -> SonarQube Scanner & Sonar Quality Gates (Install without restart).
Step 4. Go to Manage Jenkins ->Configure System -> SonarQube section and specify the details.
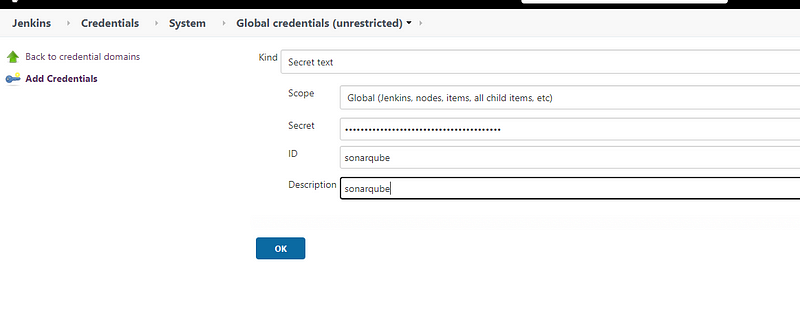
Add jenkins credentials if required
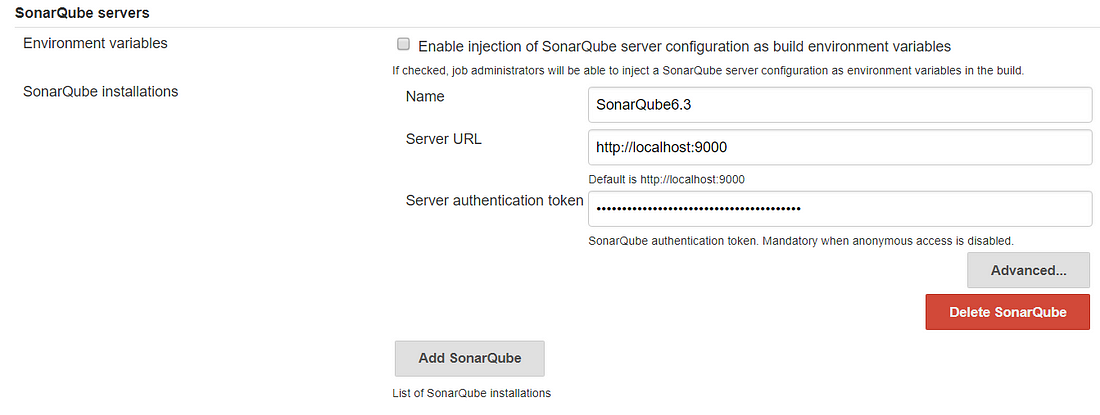
- Name: Specify the name of SonarQube to be used for future reference.
- Server URL: Specify the URL (default: http://localhost:9000) from where you can browse to the SonarQube portal
- Server Authentication Token: Provide the authentication token that was generated when you have installed SonarQube
Step 5. Go to Manage Jenkins -> Global Tool Configuration -> SonarQube Scanner .
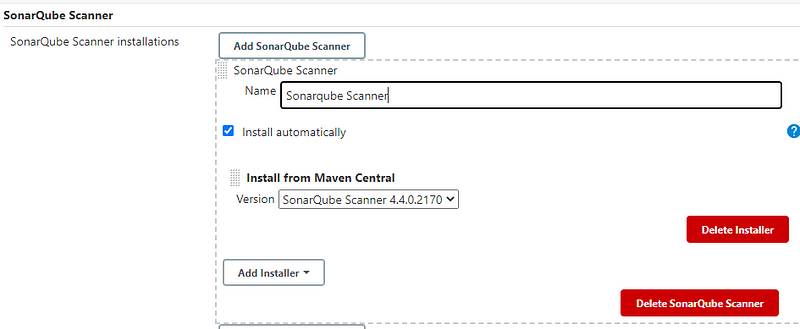
*SonarQube scanner is recommended as the default launcher to analyze a project with SonarQube.
Now you are ready for the static code analysis of the project.
Step 5. Go to Jenkins dashboard -> New Item (SonarQube-Demo) -> Freestyle project.
Step 6. Provide the repository URL (e.g. github) in the SCM section of the project configuration window.
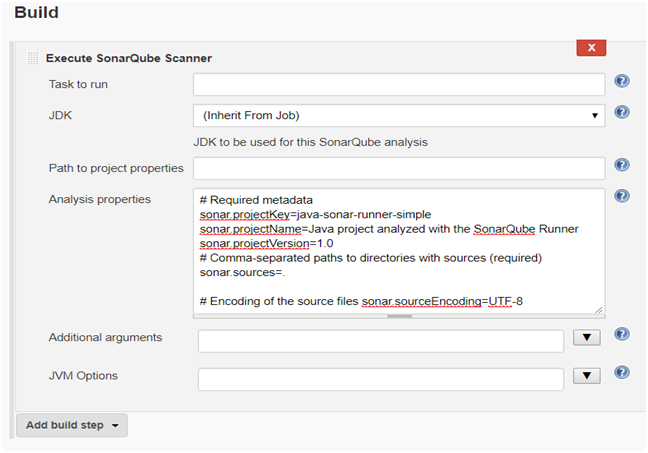
Step 7. Go to Build -> Execute SonarQube Scanner .
Step 8. Provide the location of sonar-project.properties or provide details directly for static code analysis.
*Note: To execute a sonar scan, we need to create a properties file to instruct sonar scanner on some of the details of the project. Either create the following file in the root directory of your project or write it in the configuration page of your job in Jenkins.
sonar.projectKey=java-sonar-runner-simple
sonar.projectName= project
sonar.sourceEncoding=UTF-8
sonar.sources=.
- path is relative to the sonar-project.properties file. Replace “\” by “/” on Windows.Since SonarQube 4.2 this property is optional if sonar.modules is set.If not set, SonarQube starts looking for source code from the directory containing the sonar-project.properties file.
- sonar.sources is the main property for static code analysis. With this property, you inform SonarQube which directory needs to be analyzed.
Step 9. Go to Jenkins project -> Build Now
Step 10. Once the scanning is complete, view the results on the SonarQube server instance hosted on http://localhost:9000 and check whether static code analysis for our project is available or not.
Step 11. Click the project link and check the related details.
ta-da you have your first sonar scan report !!
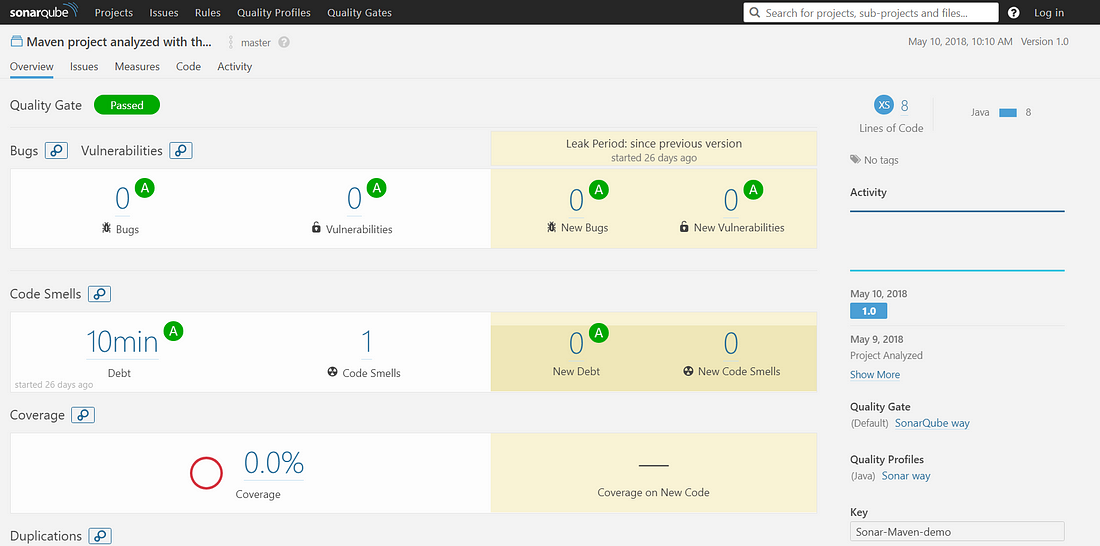
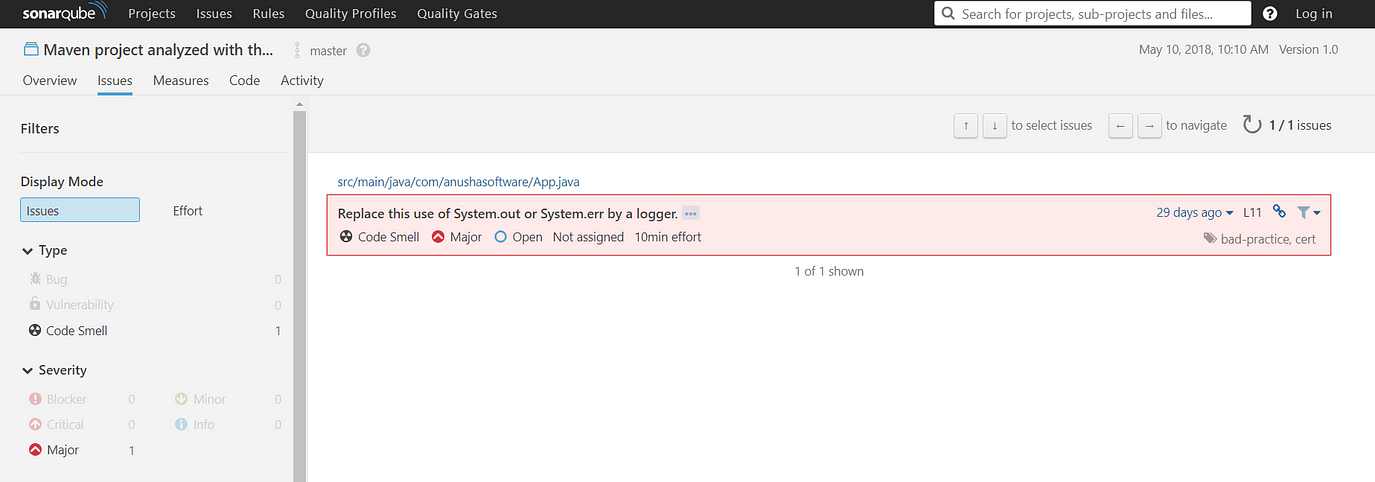
The page tells us that we have 1 code smell, but has passed the Quality Gate. Lets peek deeper to see what issues exist.
Let’s drill down the ‘Issues’ tab to see the further details.
You can visually spot the line of code by clicking on the class file (pink highlighted section)
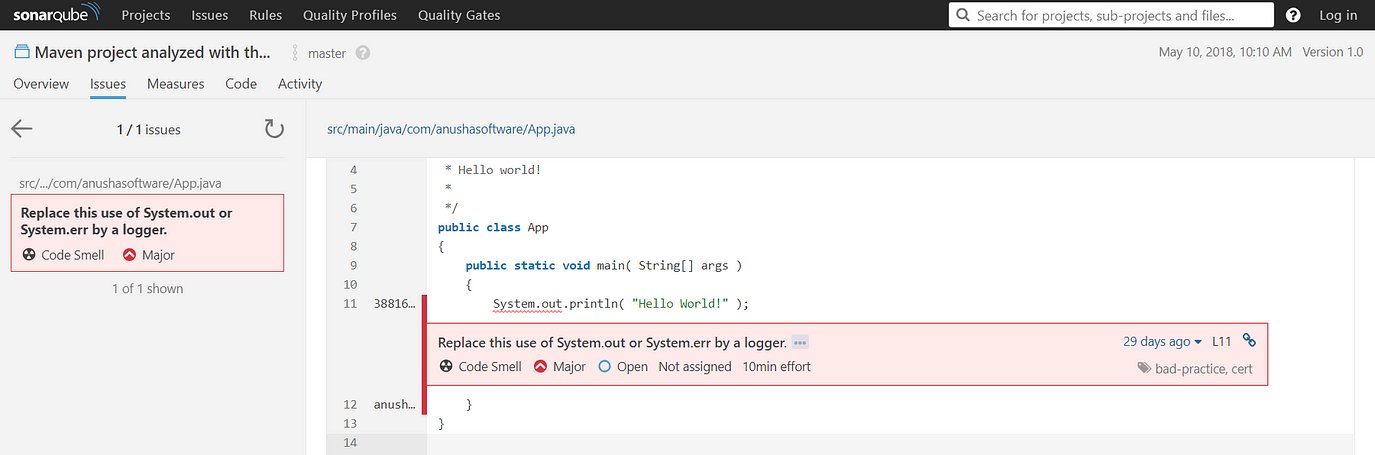
Resolve the issue in the source code : implement a logger to capture the logs. Then re-run the scanner & get your clean bill for the health of your code.