In this blog, we will learn how to monitor metrics for performance analysis, and also how to monitor and manage the real-time cost of Kubernetes resources using Prometheus and Grafana. We will deploy Prometheus and Grafana on our Kubernetes cluster.
Checkout my YouTube video for this blog
Prerequisite
- Functional Kubernetes Cluster configured
- Kubernetes 1.16+
- Helm 3+
- Kubernetes’ command-line tool, kubectl, which is the command-line interface for running commands against Kubernetes clusters.
- Helm should be installed. We will install helm on windows in this article
Agenda:
- Install Helm on Windows
- Deploying Prometheus using Helm charts
- Access the url using
port-forward - Monitoring metrics using Grafana dashboards
Install helm
On windows, you need to first install chocolate and then using chocolate you can install the helm
Run PowerShell as an administrator and run the below command
Set-ExecutionPolicy Bypass -Scope Process -Force; [System.Net.ServicePointManager]::SecurityProtocol = [System.Net.ServicePointManager]::SecurityProtocol -bor 3072; iex ((New-Object System.Net.WebClient).DownloadString('https://chocolatey.org/install.ps1'))

Now run the command prompt as an administrator and check if chocolate is installed
choco
choco install kubernetes-helm
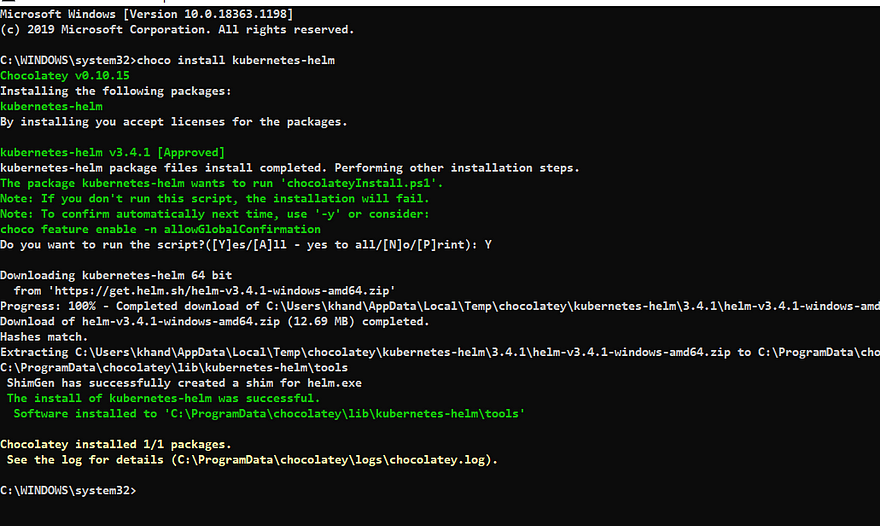
We have successfully installed helm on our windows machine. You can skip this if helm is already installed on your machine.
Deploying Prometheus using Helm charts
Now we will deploy Prometheus on a Kubernetes cluster using Helm charts:
Make sure that you have a kubernetes cluster is already running.
- Firstly, we will add the helm repository which is required
- Update the repository
helm repo add stable https://charts.helm.sh/stablehelm repo add prometheus-community https://prometheus-community.github.io/helm-charts
helm repo update

You can then run helm search repo prometheus-community to see the charts.
helm search repo prometheus-community

Let’s install the Prometheus chart. You can find more details about this chart here
helm install prometheus prometheus-community/kube-prometheus-stack

Check the status
kubectl get pods -l "release=prometheus"
kubectl get pods

This chart will install additional charts as well:
- Node-exporter on all the three nodes which are in your cluster
- Grafana
- Prometheus
- Alert Manager
- Operator
- Kube State Metrics
Now you have Prometheus installed with the bundle of components required to operate it on a Kubernetes environment.
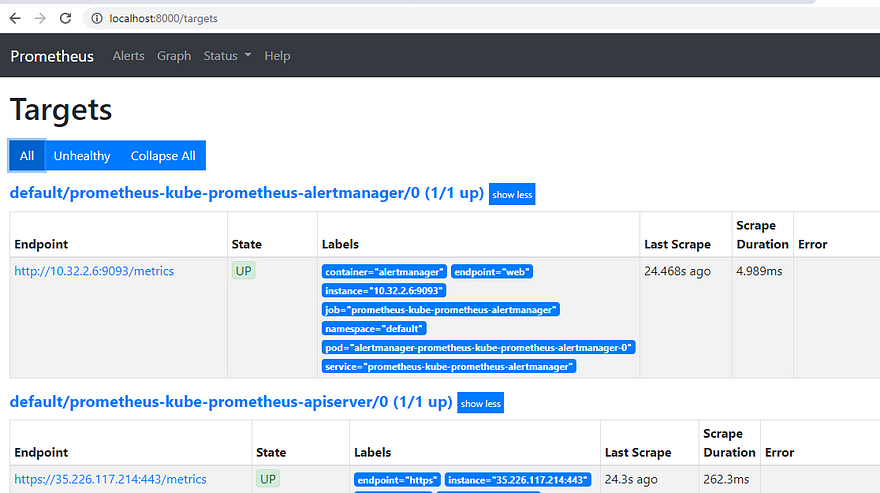
Access the Prometheus url on the browser
Now lets verify our installation and try to access it on browser using port-forward
kubectl port-forward prometheus-prometheus-kube-prometheus-prometheus-0 8000:9090
MONITORING METRICS USING GRAFANA DASHBOARDS
Grafana is an open source analytics and monitoring solution. By default, Grafana is used for querying Prometheus
kubectl get svc
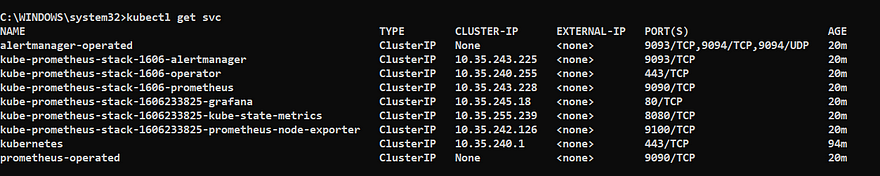
Port Forwarding
Create a port forwarding to access the Grafana UI using the kubectl port-forwardcommand. This command will forward the local port 8000 to port 3000 which is the default port of a Grafana pod:
Get the pod name using kubectl get pods
kubectl port-forward kube-prometheus-stack-1606233825-grafana-598d4d4bd6-r7pp5 8000:3000
- Open it on the browser
http://localhost:8000/login

Log in using admin as the username and prom-operatoras the password:
Import dashboard
Once you are able to login to Grafana successfully you can try exploring using the default dashboard which are provided by Grafana
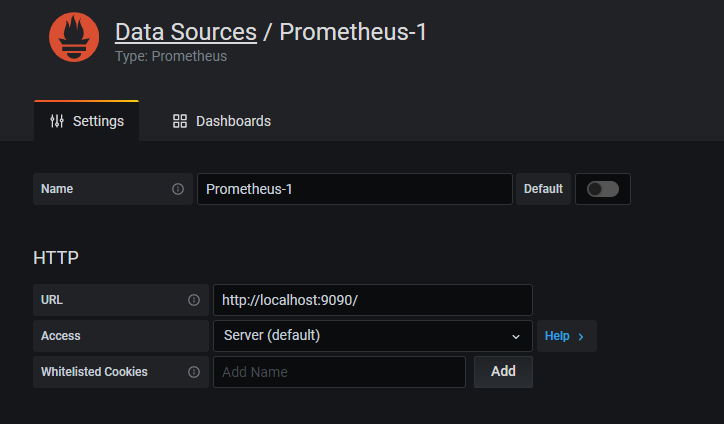
Add Prometheus DataSource
With this helm chart Prometheus data source will be added by default. You can verify as shown below:
Click on Setting ->datasources


Now we will create a dashboard which shows us all the pod details like CPU, memory, storage etc.
Grafana provides lot of dashboards which we can directly import in our Grafana instance and use it.
In this example, we will use this dashboard
Import the dashboard
Click on + icon -> Import and the save it

This is how the dashboard will look like and provide all the metrics for your pods.

Troubleshooting
When you will uninstall this chart and install it again you may see the below error
Failed d to install CRD crds/crd-alertmanagerconfigs.yaml: unable to recognize “”: no matches for kind “CustomResourceDefinition” in version “apiextensions.k8s.io/v1”
This is because cred’s didn’t get deleted with the uninstall step. Refer here for more details
kubectl delete crd alertmanagerconfigs.monitoring.coreos.com
kubectl delete crd alertmanagers.monitoring.coreos.com
kubectl delete crd podmonitors.monitoring.coreos.com
kubectl delete crd probes.monitoring.coreos.com
kubectl delete crd prometheuses.monitoring.coreos.com
kubectl delete crd prometheusrules.monitoring.coreos.com
kubectl delete crd servicemonitors.monitoring.coreos.com
kubectl delete crd thanosrulers.monitoring.coreos.com
Conclusion:
We have successfully learnt how to monitor the Kubernetes cluster using Prometheus and visualize the dashboard using Grafana.